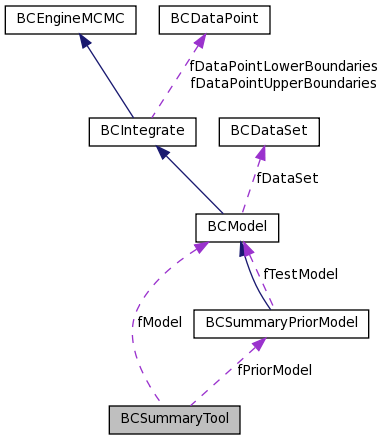
A class for summarizing the results of an analysis. More...
#include <BCSummaryTool.h>
Public Member Functions | |
Constructors and destructors | |
| BCSummaryTool () | |
| BCSummaryTool (BCModel *model) | |
| ~BCSummaryTool () | |
Member functions (set) | |
| void | SetModel (BCModel *model) |
Member functions (misc) | |
| int | CalculatePriorModel () |
| int | CopySummaryData () |
| int | PrintParameterPlot (const char *filename="parameters.eps") |
| int | PrintCorrelationPlot (const char *filename="correlation.eps") |
| int | PrintKnowlegdeUpdatePlot (const char *filename="update.eps") |
| int | PrintParameterSummary () |
| int | PrintCorrelationSummary () |
| int | PrintParameterLatex (const char *filename) |
| int | PrintCorrelationLatex () |
Static Private Member Functions | |
| static unsigned int | getNextIndex () |
Private Attributes | |
| std::vector< double > | fCorrCoeff |
| bool | fFlagInfoMarg |
| bool | fFlagInfoOpt |
| std::vector< double > | fGlobalMode |
| std::vector< double > | fMargMode |
| std::vector< double > | fMean |
| BCModel * | fModel |
| std::vector< double > | fParMax |
| std::vector< double > | fParMin |
| std::vector< std::string > | fParName |
| BCSummaryPriorModel * | fPriorModel |
| std::vector< double > | fQuantiles |
| std::vector< double > | fRMS |
| std::vector< double > | fSmallInt |
| std::vector< double > | fSumProb |
Static Private Attributes | |
| static unsigned int | fHCounter = 0 |
Detailed Description
A class for summarizing the results of an analysis.
This class can be used to summarize the results of an analysis. The prior and posterior probabilities are compared.
- Version:
- 1.0.0
- Date:
- 15.02.2010
Definition at line 33 of file BCSummaryTool.h.
Constructor & Destructor Documentation
| BCSummaryTool::BCSummaryTool | ( | ) |
The default constructor.
Definition at line 38 of file BCSummaryTool.cxx.
   : fModel(0)
   , fPriorModel(0)
   , fFlagInfoMarg(false)
   , fFlagInfoOpt(false)
{
   // define sum of probabilities for quantiles
   fSumProb.push_back(0.05);
   fSumProb.push_back(0.10);
   fSumProb.push_back(0.1587);
   fSumProb.push_back(0.50);
   fSumProb.push_back(0.8413);
   fSumProb.push_back(0.90);
   fSumProb.push_back(0.95);

   // set text style
   gStyle->SetPaintTextFormat(".2g");
}
| BCSummaryTool::BCSummaryTool | ( | BCModel * | model | ) |
A constructor.
Definition at line 58 of file BCSummaryTool.cxx.
   : fModel(model)
   , fPriorModel(0)
   , fFlagInfoMarg(false)
   , fFlagInfoOpt(false)
{
   // define sum of probabilities for quantiles
   fSumProb.push_back(0.05);
   fSumProb.push_back(0.10);
   fSumProb.push_back(0.1587);
   fSumProb.push_back(0.50);
   fSumProb.push_back(0.8413);
   fSumProb.push_back(0.90);
   fSumProb.push_back(0.95);

   // set text style
   gStyle->SetPaintTextFormat(".2g");
}
| BCSummaryTool::~BCSummaryTool | ( | ) |
Member Function Documentation
| int BCSummaryTool::CalculatePriorModel | ( | ) |
Calculate the marginalized distributions using the prior knowledge alone.
- Returns:
- An error flag.
Definition at line 639 of file BCSummaryTool.cxx.
{
   // create new prior model
   delete fPriorModel;

   fPriorModel = new BCSummaryPriorModel();

   // set model
   fPriorModel->SetTestModel(fModel);

   // perform analysis
   fPriorModel->PerformAnalysis();

   // no error
   return 1;
}
| int BCSummaryTool::CopySummaryData | ( | ) |
Copy the summary information from the model.
- Returns:
- An error flag.
Definition at line 84 of file BCSummaryTool.cxx.
{
   // check if model exists
   if (!fModel)
      return 0;

   // clear information
   fParName.clear();
   fParMin.clear();
   fParMax.clear();
   fMean.clear();
   fMargMode.clear();
   fGlobalMode.clear();
   fQuantiles.clear();
   fSmallInt.clear();
   fRMS.clear();
   fCorrCoeff.clear();

   // get number of parameters and quantiles
   int npar = fModel->GetNParameters();
   int nquantiles = int( fSumProb.size() );

   // copy information from marginalized distributions
   for (int i = 0; i < npar; ++i) {

      // copy parameter information
      fParName.push_back( (fModel->GetParameter(i)->GetName()) );
      fParMin.push_back( fModel->GetParameter(i)->GetLowerLimit() );
      fParMax.push_back( fModel->GetParameter(i)->GetUpperLimit() );

      // copy 1D marginalized information
      if (fModel->MCMCGetFlagRun()) {
         fFlagInfoMarg = true;
         BCH1D * bch1d_temp = fModel->GetMarginalized( fModel->GetParameter(i) );
         fMean.push_back( bch1d_temp->GetMean() );
         fRMS.push_back( bch1d_temp->GetRMS() );
         fMargMode.push_back( bch1d_temp->GetMode() );
         for (int j = 0; j < nquantiles; ++j)
            fQuantiles.push_back( bch1d_temp->GetQuantile( fSumProb.at(j) ) );
         std::vector <double> intervals = bch1d_temp->GetSmallestIntervals();
         int nintervals = int(intervals.size() / 5);
         fSmallInt.push_back(nintervals);
         fSmallInt.insert( fSmallInt.end(), intervals.begin(), intervals.end() );

         // copy 2D margnialized information
         for (int j = 0; j < npar; ++j) {
            if (i!=j) {
               BCH2D * bch2d_temp = fModel->GetMarginalized(fModel->GetParameter(i),fModel->GetParameter(j));
               fCorrCoeff.push_back( bch2d_temp->GetHistogram()->GetCorrelationFactor() );
            }
            else
               fCorrCoeff.push_back(1.0);
         }
      }
      else {
         //       BCLog::OutWarning("BCSummaryTool::CopySummaryData(). No information on marginalized distributions present.");
      }

      // copy optimization information
      if ((fModel->GetBestFitParameters()).size() > 0) {
         fFlagInfoOpt = true;
         fGlobalMode.push_back ( (fModel->GetBestFitParameters()).at(i) );
      }
      else {
         //       BCLog::OutWarning("BCSummaryTool::CopySummaryData(). No information on optimization present.");
      }
   }

   // no error
   return 1;
};
| static unsigned int BCSummaryTool::getNextIndex | ( | ) | [inline, static, private] |
Helper method to get an unique number to be used in histogram naming
Definition at line 123 of file BCSummaryTool.h.
{ return ++fHCounter; }
| int BCSummaryTool::PrintCorrelationLatex | ( | ) | [inline] |
Print a Latex table of the correlations. (not yet implemented)
- Returns:
- An error flag.
Definition at line 116 of file BCSummaryTool.h.
{ return 1; };
| int BCSummaryTool::PrintCorrelationPlot | ( | const char * | filename = "correlation.eps" |
) |
Print a correlation plot for the parameters.
- Returns:
- An error flag.
Definition at line 308 of file BCSummaryTool.cxx.
{
   // copy summary data
   if (!CopySummaryData())
      return 0;

   // check if marginalized information is there
   if (!fFlagInfoMarg)
      return 0;

   // get number of parameters
   int npar = fModel->GetNParameters();

   // create histogram
   TH2D * hist_corr = new TH2D(
         TString::Format("hist_corr_%d",getNextIndex()),
         ";;",npar, -0.5, npar-0.5,npar, -0.5, npar-0.5);
   hist_corr->SetStats(kFALSE);
   hist_corr->GetXaxis()->SetTickLength(0.0);
// hist_corr->GetXaxis()->SetLabelOffset(0.03);
   hist_corr->GetYaxis()->SetTickLength(0.0);
// hist_corr->GetYaxis()->SetLabelOffset(0.03);
   hist_corr->GetZaxis()->SetRangeUser(-1.0, 1.0);

   for (int i = 0; i < npar; ++i) {
      hist_corr->GetXaxis()->SetLabelSize(0.06);
      hist_corr->GetYaxis()->SetLabelSize(0.06);
      if (npar < 5) {
         hist_corr->GetXaxis()->SetBinLabel( i+1, fParName.at(i).c_str() );
         hist_corr->GetYaxis()->SetBinLabel( npar-i, fParName.at(i).c_str() );
      }
      else {
         hist_corr->GetXaxis()->SetBinLabel( i+1, TString::Format("%d",i) );
         hist_corr->GetYaxis()->SetBinLabel( npar-i, TString::Format("%d",i) );
      }
   }

   // fill plot
   for (int i = 0; i < npar; ++i)
      for (int j = 0; j < npar; ++j) {
         int index = i * npar + j;
         double corr = fCorrCoeff.at(index);
         hist_corr->SetBinContent(i+1, npar-j, corr);
      }

   // print to file
   TCanvas * c_corr = new TCanvas(TString::Format("c_corr_%d",getNextIndex()));
   c_corr->cd();
   hist_corr->Draw("colz text");

   TF1 * f = new TF1("fUp","x",-0.5,npar-0.5);
   TGaxis * A1 = new TGaxis(-0.5,npar-0.5,npar-0.5,npar-0.5,"fUp",100,"-");
   A1->ImportAxisAttributes(hist_corr->GetXaxis());
   A1->Draw();

   // redraw the histogram to overlay thetop axis tick marks since
   // we don't know how to make them disappear
   hist_corr->GetXaxis()->SetLabelSize(0.);
   hist_corr->Draw("colz text same");

   // redraw top and right axes
   TLine * lA1 = new TLine(-0.5,npar-0.5,npar-0.5,npar-0.5);
   lA1->Draw("same");
   TLine * lA2 = new TLine(npar-0.5,npar-0.5,npar-0.5,-0.5);
   lA2->Draw("same");

   gPad->RedrawAxis();
   c_corr->Print(filename);

   delete f;
   delete A1;
   delete lA1;
   delete lA2;
   delete hist_corr;
   delete c_corr;

   // no error
   return 1;
}
| int BCSummaryTool::PrintCorrelationSummary | ( | ) | [inline] |
Print correlation summary as text. (not yet implemented)
- Returns:
- An error flag.
Definition at line 106 of file BCSummaryTool.h.
{ return 1; };
| int BCSummaryTool::PrintKnowlegdeUpdatePlot | ( | const char * | filename = "update.eps" |
) |
Print a comparison of the prior knowledge to the posterior knowledge for each parameter.
- Returns:
- An error flag.
Definition at line 389 of file BCSummaryTool.cxx.
{
   // perform analysis
   CalculatePriorModel();

   // create postscript
   TPostScript * ps = new TPostScript(filename);

   // create canvas and prepare postscript
   TCanvas * c_update = new TCanvas(TString::Format("c_update_%d",getNextIndex()));

   c_update->Update();
   ps->NewPage();
   c_update->cd();

   // create legend
   TLegend * legend1d = new TLegend(0.15, 0.88, 0.85, 0.94);
   legend1d->SetBorderSize(0);
   legend1d->SetFillColor(0);

   // loop over all parameters
   int npar = fModel->GetNParameters();
   for (int i = 0; i < npar; ++i) {
      // update post script
      c_update->Update();
      ps->NewPage();
      c_update->cd();

      // get histograms;
      BCParameter * par = fModel->GetParameter(i);
      TH1D * hist_prior = fPriorModel->GetMarginalized(par)->GetHistogram();
      hist_prior->SetLineColor(kRed);
      TH1D * hist_posterior = fModel->GetMarginalized(par)->GetHistogram();

      // add entries
      if (!i) {
         legend1d->AddEntry(hist_prior, "Prior probability", "L");
         legend1d->AddEntry(hist_posterior, "Posterior probability", "L");
      }

      // scale histogram
      hist_prior->Scale(hist_posterior->Integral()/hist_prior->Integral());

      // get maximum
      double max_prior = hist_prior->GetMaximum();
      double max_posterior = hist_posterior->GetMaximum();
      double max = 1.1 * TMath::Max(max_prior, max_posterior);

      // plot
      c_update->cd();
      hist_prior->GetXaxis()->SetNdivisions(508);
      hist_posterior->GetXaxis()->SetNdivisions(508);
      hist_prior->Draw();
      hist_posterior->Draw("SAME");
      legend1d->Draw("SAME");

      // scale axes
      hist_prior->GetYaxis()->SetRangeUser(0.0, max);
      hist_posterior->GetYaxis()->SetRangeUser(0.0, max);
   }

   // create legend
   TLegend * legend2d = new TLegend(0.15, 0.88, 0.85, 0.99);
   legend2d->SetBorderSize(0);
   legend2d->SetFillColor(0);

   // create markers and arrows
   TMarker * marker_prior = new TMarker();
   marker_prior->SetMarkerStyle(24);
   marker_prior->SetMarkerColor(kRed);

   TMarker * marker_posterior = new TMarker();
   marker_posterior->SetMarkerStyle(24);
   marker_posterior->SetMarkerColor(kBlack);

   TArrow * arrow = new TArrow();
   arrow->SetArrowSize(0.02);
   arrow->SetLineColor(kBlue);
   arrow->SetLineStyle(2);

   // loop over all parameters
   for (int i = 0; i < npar; ++i) {
      for (int j = 0; j < i; ++j) {
         // update post script
         c_update->Update();
         ps->NewPage();
         c_update->cd();

         // get parameters
         BCParameter * par1 = fModel->GetParameter(i);
         BCParameter * par2 = fModel->GetParameter(j);

         // get 2-d histograms
         BCH2D * bch2d_2dprior = fPriorModel->GetMarginalized(par1, par2);
         BCH2D * bch2d_2dposterior = fModel->GetMarginalized(par1, par2);

         // get histograms
         TH2D * hist_2dprior = bch2d_2dprior->GetHistogram();
         hist_2dprior->SetLineColor(kRed);
         TH2D * hist_2dposterior = bch2d_2dposterior->GetHistogram();

         // scale histograms
         hist_2dprior->Scale(1.0/hist_2dprior->Integral("width"));
         hist_2dposterior->Scale(1.0/hist_2dposterior->Integral("width"));

         // calculate contours
         bch2d_2dprior -> CalculateIntegratedHistogram();
         bch2d_2dposterior -> CalculateIntegratedHistogram();

         double level[1] = {bch2d_2dprior->GetLevel(0.32)};
         hist_2dprior->SetContour(1, level);
         hist_2dprior->Draw("CONT3");
         level[0] = bch2d_2dposterior->GetLevel(0.32);
         hist_2dposterior->SetContour(1, level);
         hist_2dposterior->Draw("CONT3 SAME");

         std::vector <double> mode_prior = fPriorModel->GetBestFitParameters();
         std::vector <double> mode_posterior = fModel->GetBestFitParameters();

         marker_prior->DrawMarker(mode_prior.at(j), mode_prior.at(i));
         marker_posterior->DrawMarker(mode_posterior.at(j), mode_posterior.at(i));
         arrow->DrawArrow(mode_prior.at(j), mode_prior.at(i), mode_posterior.at(j), mode_posterior.at(i));

         if (i==1 && j == 0) {
            legend2d->AddEntry(hist_2dprior, "68% prior contour", "L");
            legend2d->AddEntry(hist_2dposterior, "68% posterior contour", "L");
            legend2d->AddEntry(marker_prior, "Prior mode", "P");
            legend2d->AddEntry(marker_posterior, "Posterior mode", "P");
            legend2d->AddEntry(arrow, "Change in mode", "L");
         }
         legend2d->Draw();
      }
   }

   // close ps
   c_update->Update();
   ps->Close();

   // free memory
   delete legend1d;
   delete legend2d;
   delete marker_prior;
   delete marker_posterior;
   delete arrow;
   delete ps;
   delete c_update;

   // no error
   return 1;
}
| int BCSummaryTool::PrintParameterLatex | ( | const char * | filename | ) |
Print a Latex table of the parameters.
- Returns:
- An error flag.
Definition at line 581 of file BCSummaryTool.cxx.
{
   // open file
   std::ofstream ofi(filename);
   ofi.precision(3);

   // check if file is open
   if(!ofi.is_open()) {
      std::cerr << "Couldn't open file " << filename <<std::endl;
      return 0;
   }

   // get number of parameters and quantiles
   int npar = fModel->GetNParameters();

   // print table
   ofi
      << "\\documentclass[11pt, a4paper]{article}" << std::endl
      << std::endl
      << "\\begin{document}" << std::endl
      << std::endl
      << "\\begin{table}[ht!]" << std::endl
      << "\\begin{center}" << std::endl
      <<"\\begin{tabular}{llllllll}" << std::endl
      << "\\hline" << std::endl
      << "Parameter & Mean & RMS & Gl. mode & Mode & Median & 16\\% quant. & 84\\% quant. \\\\" << std::endl
      << "\\hline" << std::endl;

   for (int i = 0; i < npar; ++i) {
      BCParameter * par = fModel->GetParameter(i);
      BCH1D * bch1d = fModel->GetMarginalized(par);
      ofi
         << par->GetName() << " & "
         << bch1d->GetMean() << " & "
         << bch1d->GetRMS() << " & "
         << fModel->GetBestFitParameters().at(i) << " & "
         << bch1d->GetMode() << " & "
         << bch1d->GetMedian() << " & "
         << bch1d->GetQuantile(0.16) << " & "
         << bch1d->GetQuantile(0.84) << " \\\\" << std::endl;
   }
   ofi
      << "\\hline" << std::endl
      << "\\end{tabular}" << std::endl
      << "\\caption{Summary of the parameter estimates.}" << std::endl
      << "\\end{center}" << std::endl
      << "\\end{table}" << std::endl
      << std::endl
      << "\\end{document}" << std::endl;

   // close file
   ofi.close();

   // no error
   return 1;
}
| int BCSummaryTool::PrintParameterPlot | ( | const char * | filename = "parameters.eps" |
) |
Print a summary plot for the parameters.
- Returns:
- An error flag.
Definition at line 157 of file BCSummaryTool.cxx.
{
   // copy summary data
   if (!CopySummaryData())
      return 0;

   // get number of parameters and quantiles
   int npar = fModel->GetNParameters();
   int nquantiles = int( fSumProb.size() );

   // create histogram
   TH1D * hist_axes = new TH1D(
         TString::Format("hist_axes_par_%d",getNextIndex()),
         ";;Scaled parameter range [a.u.]",npar, -0.5, npar-0.5);
   hist_axes->SetStats(kFALSE);
   for (int i = 0; i < npar; ++i)
      hist_axes->GetXaxis()->SetBinLabel( i+1, fParName.at(i).c_str() );
// hist_axes->GetXaxis()->SetLabelOffset(0.03);
   hist_axes->GetXaxis()->SetLabelSize(0.06);
   hist_axes->GetXaxis()->SetTickLength(0.0);
   hist_axes->GetYaxis()->SetRangeUser(-0.1, 1.1);
   hist_axes->GetYaxis()->SetTickLength(0.0);

   // create graphs
   TGraphErrors * graph_quantiles = new TGraphErrors(npar*nquantiles);
   graph_quantiles->SetMarkerSize(0);
   graph_quantiles->SetLineColor(38);
   graph_quantiles->SetLineStyle(2);

   TGraphErrors * graph_mean = new TGraphErrors(npar);
   graph_mean->SetMarkerColor(kBlack);
   graph_mean->SetMarkerStyle(20);

   TGraphErrors * graph_mode = new TGraphErrors(npar);
   graph_mode->SetMarkerColor(kRed);
   graph_mode->SetMarkerStyle(20);

   TGraphAsymmErrors * graph_intervals = new TGraphAsymmErrors(0);
   graph_intervals->SetFillColor(kYellow);
   graph_intervals->SetLineStyle(2);
   graph_intervals->SetLineColor(kRed);
   graph_intervals->SetMarkerSize(0);

   // fill graphs
   int indexintervals = 0;

   // fill graph quantiles
   if (fFlagInfoMarg) {
      for (int i = 0; i < npar; ++i) {
         for (int j = 0; j < nquantiles; ++j) {
            graph_quantiles->SetPoint(i*nquantiles+j,double(i),
                  (fQuantiles.at(i*nquantiles+j) - fParMin.at(i))/(fParMax.at(i)-fParMin.at(i)));
            graph_quantiles->SetPointError(i*nquantiles+j, 0.5, 0.0);
         }
      }
   }

   // fill graph mean and rms
   if (fFlagInfoMarg) {
      for (int i = 0; i < npar; ++i) {
         // fill graph mean
         graph_mean->SetPoint(i, double(i), (fMean.at(i) - fParMin.at(i))/(fParMax.at(i)-fParMin.at(i)));
         graph_mean->SetPointError(i, 0.0, fRMS.at(i)/(fParMax.at(i)-fParMin.at(i)));
      }
   }

   // fill graph mode
   if (fFlagInfoOpt) {
      for (int i = 0; i < npar; ++i)
         graph_mode->SetPoint(i, double(i), (fGlobalMode.at(i) - fParMin.at(i))/(fParMax.at(i)-fParMin.at(i)));
   }

   // fill graph smallest intervals
   if (fFlagInfoMarg) {
      for (int i = 0; i < npar; ++i) {
         int nintervals = int(fSmallInt.at(indexintervals++));
         for (int j = 0; j < nintervals; ++j) {
            double xmin = fSmallInt.at(indexintervals++);
            double xmax = fSmallInt.at(indexintervals++);
            indexintervals++;
            double xlocalmaxpos = fSmallInt.at(indexintervals++);
            indexintervals++;
            int npoints = graph_intervals->GetN();
            graph_intervals->SetPoint(npoints,double(i),
                  (xlocalmaxpos - fParMin.at(i))/(fParMax.at(i)-fParMin.at(i)));
            graph_intervals->SetPointError(npoints,0.5, 0.5,
                  (xlocalmaxpos - xmin)/(fParMax.at(i)-fParMin.at(i)),
                  (xmax - xlocalmaxpos)/(fParMax.at(i)-fParMin.at(i)));
         }
      }
   }

   // create legend
   TLegend * legend = new TLegend(0.15, 0.88, 0.85, 0.99);
   legend->SetBorderSize(0);
   legend->SetFillColor(0);

   // create latex
   TLatex * latex = new TLatex();
   latex->SetTextSize(0.02);

   // create lines
   TLine * line_top = new TLine(-0.5, 1.0, npar-0.5, 1.0);
   line_top->SetLineColor(kBlack);
   line_top->SetLineStyle(1);
   line_top->SetLineWidth(2);

   TLine * line_bot = new TLine(-0.5, 0.0, npar-0.5, 0.0);
   line_bot->SetLineColor(kBlack);
   line_bot->SetLineStyle(1);
   line_bot->SetLineWidth(2);

   // print to file
   TCanvas * c_par = new TCanvas(TString::Format("c_par_%d",getNextIndex()));
   c_par->cd();
   hist_axes->Draw();
   line_top->Draw();
   line_bot->Draw();
   if (fFlagInfoMarg) {
      graph_intervals->DrawClone("SAME2");
      for (int i = 0; i < graph_intervals->GetN(); ++i)
         graph_intervals->SetPointError(i, 0.5, 0.5, 0.0, 0.0);
      graph_intervals->Draw("SAMEPZ");
      graph_quantiles->Draw("SAMEPZ");
      graph_mean->Draw("SAMEP");
      legend->AddEntry(graph_quantiles, "Quantiles (5%, 10%, 16%, 50%, 84%, 90%, 95%)", "L");
      legend->AddEntry(graph_mean,      "Mean and RMS", "LEP");
      legend->AddEntry(graph_intervals, "Smallest 68% intervals and local modes", "FL");
   }
   if (fFlagInfoOpt) {
      graph_mode->Draw("SAMEP");
      legend->AddEntry(graph_mode,      "Global mode", "P");
   }
   for (int i = 0; i < npar;++i) {
      //    latex->DrawLatex(double(i)-0.1, 0.010, Form("%+3.3f", fParMin.at(i)));
      //    latex->DrawLatex(double(i)-0.1, 0.965, Form("%+3.3f", fParMax.at(i)));
      latex->DrawLatex(double(i)-0.1, 0.010-0.07, Form("%+3.3f", fParMin.at(i)));
      latex->DrawLatex(double(i)-0.1, 0.965+0.07, Form("%+3.3f", fParMax.at(i)));
   }
   latex->SetNDC();
   latex->DrawLatex(0.9, 0.175, "Par. min.");
   latex->DrawLatex(0.9, 0.83, "Par. max.");
   legend->Draw("SAME");
   gPad->RedrawAxis();
   c_par->Print(filename);

   // no error
   return 1;
}
| int BCSummaryTool::PrintParameterSummary | ( | ) | [inline] |
Print parameter summary as text. (not yet implemented)
- Returns:
- An error flag.
Definition at line 101 of file BCSummaryTool.h.
{ return 1; };
| void BCSummaryTool::SetModel | ( | BCModel * | model | ) | [inline] |
Set the model to be summarized.
- Parameters:
-
model The BCModel to be summarized.
Definition at line 63 of file BCSummaryTool.h.
{ fModel = model; };
Member Data Documentation
std::vector<double> BCSummaryTool::fCorrCoeff [private] |
Correlation coefficients. Length of vector equals number of parameters * number of parameters.
Definition at line 148 of file BCSummaryTool.h.
bool BCSummaryTool::fFlagInfoMarg [private] |
A flag: check if marginalized information is present
Definition at line 194 of file BCSummaryTool.h.
bool BCSummaryTool::fFlagInfoOpt [private] |
A flag: check if optimization information is present
Definition at line 198 of file BCSummaryTool.h.
std::vector<double> BCSummaryTool::fGlobalMode [private] |
Global modes.
Length of vector equals number of parameters.
Definition at line 163 of file BCSummaryTool.h.
unsigned int BCSummaryTool::fHCounter = 0 [static, private] |
helper variable to get an unique number to be used in histogram naming
Definition at line 127 of file BCSummaryTool.h.
std::vector<double> BCSummaryTool::fMargMode [private] |
Marginalized modes.
Length of vector equals number of parameters.
Definition at line 153 of file BCSummaryTool.h.
std::vector<double> BCSummaryTool::fMean [private] |
Mean values.
Length of vector equals number of parameters.
Definition at line 158 of file BCSummaryTool.h.
BCModel* BCSummaryTool::fModel [private] |
The model which results are summarized
Definition at line 131 of file BCSummaryTool.h.
std::vector<double> BCSummaryTool::fParMax [private] |
Parameter maxima
Definition at line 143 of file BCSummaryTool.h.
std::vector<double> BCSummaryTool::fParMin [private] |
parameter minima
Definition at line 139 of file BCSummaryTool.h.
std::vector<std::string> BCSummaryTool::fParName [private] |
parameter names
Definition at line 135 of file BCSummaryTool.h.
BCSummaryPriorModel* BCSummaryTool::fPriorModel [private] |
A model for calculating the marginalized distributions for the prior probabilities.
Definition at line 190 of file BCSummaryTool.h.
std::vector<double> BCSummaryTool::fQuantiles [private] |
Quantiles.
The following quantiles are stored: 0.05, 0.10, 0.16, 0.5, 0.84, 0.90, 0.95.
Length of vector equals number of parameters * number of quantiles.
Definition at line 169 of file BCSummaryTool.h.
std::vector<double> BCSummaryTool::fRMS [private] |
RMS values.
Length of vector equals number of parameters.
Definition at line 181 of file BCSummaryTool.h.
std::vector<double> BCSummaryTool::fSmallInt [private] |
Smallest intervals.
For each parameter a set of the smallest intervals is recorded.
Structure: number of intervals n + n * (start, stop, local max, local max pos, integral) Length of vector equals number of parameters * number of quantiles.
Definition at line 176 of file BCSummaryTool.h.
std::vector<double> BCSummaryTool::fSumProb [private] |
Sum of probabilities for quantiles
Definition at line 185 of file BCSummaryTool.h.
The documentation for this class was generated from the following files: