A class for summarizing the results of an analysis. More...
#include <BCSummaryTool.h>
Public Member Functions | |
Constructors and destructors | |
| BCSummaryTool () | |
| BCSummaryTool (BCModel *model) | |
| ~BCSummaryTool () | |
Member functions (get) | |
| BCSummaryPriorModel * | GetPriorModel () |
Member functions (set) | |
| void | SetModel (BCModel *model) |
Member functions (misc) | |
| int | CalculatePriorModel () |
| int | CopySummaryData () |
| int | PrintParameterPlot (const char *filename="parameters.pdf") |
| int | PrintCorrelationMatrix (const char *filename="matrix.pdf") |
| int | PrintCorrelationPlot (const char *filename="correlation.pdf") |
| int | DrawKnowledgeUpdatePlot1D (int index, std::string options_post="", std::string options_prior="") |
| int | PrintKnowledgeUpdatePlot1D (int index, const char *filename, std::string options_post="", std::string options_prior="") |
| int | PrintKnowledgeUpdatePlots (const char *filename="update.pdf", std::string options="") |
| int | PrintParameterLatex (const char *filename) |
Static Private Member Functions | |
| static unsigned int | getNextIndex () |
Private Attributes | |
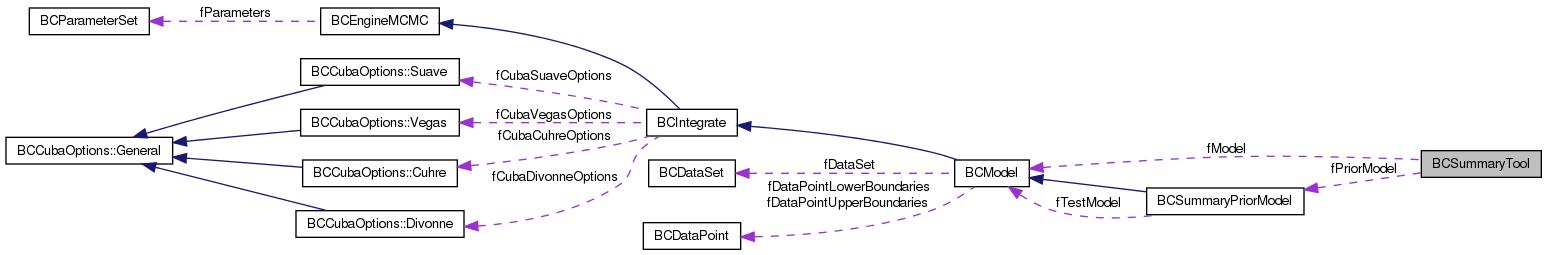
| BCModel * | fModel |
| std::vector< std::string > | fParName |
| std::vector< double > | fParMin |
| std::vector< double > | fParMax |
| std::vector< double > | fCorrCoeff |
| std::vector< double > | fMargMode |
| std::vector< double > | fMean |
| std::vector< double > | fGlobalMode |
| std::vector< double > | fQuantiles |
| std::vector< double > | fSmallInt |
| std::vector< double > | fRMS |
| std::vector< double > | fSumProb |
| BCSummaryPriorModel * | fPriorModel |
| bool | fFlagInfoMarg |
| bool | fFlagInfoOpt |
Static Private Attributes | |
| static unsigned int | fHCounter =0 |
Detailed Description
A class for summarizing the results of an analysis.
This class can be used to summarize the results of an analysis. The prior and posterior probabilities are compared.
- Version
- 1.0.0
- Date
- 15.02.2010
Definition at line 34 of file BCSummaryTool.h.
Constructor & Destructor Documentation
| BCSummaryTool::BCSummaryTool | ( | ) |
| BCSummaryTool::BCSummaryTool | ( | BCModel * | model) |
| BCSummaryTool::~BCSummaryTool | ( | ) |
The default destructor.
Definition at line 82 of file BCSummaryTool.cxx.
Member Function Documentation
| int BCSummaryTool::CalculatePriorModel | ( | ) |
Calculate the marginalized distributions using the prior knowledge alone.
- Returns
- An error flag.
Definition at line 931 of file BCSummaryTool.cxx.
| int BCSummaryTool::CopySummaryData | ( | ) |
Copy the summary information from the model.
- Returns
- An error flag.
Definition at line 88 of file BCSummaryTool.cxx.
| int BCSummaryTool::DrawKnowledgeUpdatePlot1D | ( | int | index, |
| std::string | options_post = "", |
||
| std::string | options_prior = "" |
||
| ) |
Draw a comparison of the prior knowledge to the posterior knowledge for each parameter.
- Returns
- An error flag.
Definition at line 583 of file BCSummaryTool.cxx.
|
inlinestaticprivate |
Helper method to get an unique number to be used in histogram naming
Definition at line 131 of file BCSummaryTool.h.
|
inline |
Retrieve pointer to the Prior model to allow for its detailed setup
Definition at line 59 of file BCSummaryTool.h.
| int BCSummaryTool::PrintCorrelationMatrix | ( | const char * | filename = "matrix.pdf") |
Print a correlation matrix for the parameters.
- Returns
- An error flag.
Definition at line 317 of file BCSummaryTool.cxx.
| int BCSummaryTool::PrintCorrelationPlot | ( | const char * | filename = "correlation.pdf") |
Print a correlation plot for the parameters.
- Returns
- An error flag.
Definition at line 414 of file BCSummaryTool.cxx.
| int BCSummaryTool::PrintKnowledgeUpdatePlot1D | ( | int | index, |
| const char * | filename, | ||
| std::string | options_post = "", |
||
| std::string | options_prior = "" |
||
| ) |
Print a comparison of the prior knowledge to the posterior knowledge for each parameter.
- Returns
- An error flag.
Definition at line 563 of file BCSummaryTool.cxx.
| int BCSummaryTool::PrintKnowledgeUpdatePlots | ( | const char * | filename = "update.pdf", |
| std::string | options = "" |
||
| ) |
Print a comparison of the prior knowledge to the posterior knowledge for each parameter.
- Returns
- An error flag.
Definition at line 709 of file BCSummaryTool.cxx.
| int BCSummaryTool::PrintParameterLatex | ( | const char * | filename) |
Print a Latex table of the parameters.
- Returns
- An error flag.
Definition at line 873 of file BCSummaryTool.cxx.
| int BCSummaryTool::PrintParameterPlot | ( | const char * | filename = "parameters.pdf") |
Print a summary plot for the parameters.
- Returns
- An error flag.
Definition at line 166 of file BCSummaryTool.cxx.
|
inline |
Set the model to be summarized.
- Parameters
-
model The BCModel to be summarized.
Definition at line 69 of file BCSummaryTool.h.
Member Data Documentation
|
private |
Correlation coefficients. Length of vector equals number of parameters * number of parameters.
Definition at line 156 of file BCSummaryTool.h.
|
private |
A flag: check if marginalized information is present
Definition at line 202 of file BCSummaryTool.h.
|
private |
A flag: check if optimization information is present
Definition at line 206 of file BCSummaryTool.h.
|
private |
Global modes.
Length of vector equals number of parameters.
Definition at line 171 of file BCSummaryTool.h.
|
staticprivate |
helper variable to get an unique number to be used in histogram naming
Definition at line 135 of file BCSummaryTool.h.
|
private |
Marginalized modes.
Length of vector equals number of parameters.
Definition at line 161 of file BCSummaryTool.h.
|
private |
Mean values.
Length of vector equals number of parameters.
Definition at line 166 of file BCSummaryTool.h.
|
private |
The model whose results are summarized
Definition at line 139 of file BCSummaryTool.h.
|
private |
Parameter maxima
Definition at line 151 of file BCSummaryTool.h.
|
private |
parameter minima
Definition at line 147 of file BCSummaryTool.h.
|
private |
parameter names
Definition at line 143 of file BCSummaryTool.h.
|
private |
A model for calculating the marginalized distributions for the prior probabilities.
Definition at line 198 of file BCSummaryTool.h.
|
private |
Quantiles.
The following quantiles are stored: 0.05, 0.10, 0.16, 0.5, 0.84, 0.90, 0.95.
Length of vector equals number of parameters * number of quantiles.
Definition at line 177 of file BCSummaryTool.h.
|
private |
RMS values.
Length of vector equals number of parameters.
Definition at line 189 of file BCSummaryTool.h.
|
private |
Smallest intervals.
For each parameter a set of the smallest intervals is recorded.
Structure: number of intervals n + n * (start, stop, local max, local max pos, integral) Length of vector equals number of parameters * number of quantiles.
Definition at line 184 of file BCSummaryTool.h.
|
private |
Sum of probabilities for quantiles
Definition at line 193 of file BCSummaryTool.h.
The documentation for this class was generated from the following files: