A class for fitting histograms with functions. More...
#include <BCEfficiencyFitter.h>
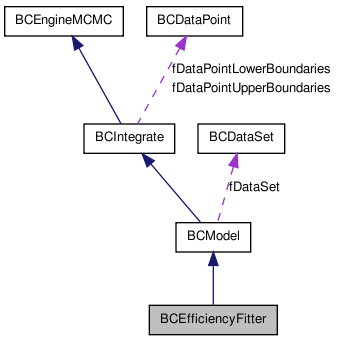
Inherits BCModel.
Public Member Functions | |
Constructors and destructors | |
| BCEfficiencyFitter () | |
| BCEfficiencyFitter (const char *name) | |
| BCEfficiencyFitter (TH1D *hist1, TH1D *hist2, TF1 *func) | |
| BCEfficiencyFitter (const char *name, TH1D *hist1, TH1D *hist2, TF1 *func) | |
| ~BCEfficiencyFitter () | |
Member functions (get) | |
| TH1D * | GetHistogram1 () |
| TH1D * | GetHistogram2 () |
| TGraphAsymmErrors * | GetHistogramRatio () |
| TF1 * | GetFitFunction () |
| TGraph * | GetErrorBand () |
| TGraph * | GetGraphFitFunction () |
| int | GetUncertainties (int n, int k, double p, double &xexp, double &xmin, double &xmax) |
Member functions (set) | |
| int | SetHistograms (TH1D *hist1, TH1D *hist2) |
| int | SetFitFunction (TF1 *func) |
| void | SetFlagIntegration (bool flag) |
| void | SetDataPointType (int type) |
Member functions (miscellaneous methods) | |
| virtual double | LogLikelihood (const std::vector< double > ¶meters) |
| double | FitFunction (const std::vector< double > &x, const std::vector< double > ¶meters) |
| int | Fit () |
| int | Fit (TH1D *hist1, TH1D *hist2, TF1 *func) |
| void | DrawFit (const char *options="", bool flaglegend=false) |
| int | CalculatePValueFast (const std::vector< double > &par, double &pvalue) |
Private Attributes | |
| TH1D * | fHistogram1 |
| TH1D * | fHistogram2 |
| TGraphAsymmErrors * | fHistogramRatio |
| TF1 * | fFitFunction |
| bool | fFlagIntegration |
| TGraph * | fErrorBand |
| TGraph * | fGraphFitFunction |
| TH1D * | fHistogramBinomial |
| unsigned int | fDataPointType |
Detailed Description
A class for fitting histograms with functions.
- Version:
- 1.0
- Date:
- 11.2008 This class allows fitting of efficiencies defined as a ratio of two TH1D histograms using a TF1 function. It uses binomial probabilities calculated based on the number of entries in histograms. This is only applicable if the numerator is a subset of the denominator.
Definition at line 38 of file BCEfficiencyFitter.h.
Constructor & Destructor Documentation
| BCEfficiencyFitter::BCEfficiencyFitter | ( | ) |
The default constructor.
Definition at line 31 of file BCEfficiencyFitter.cxx.
 : BCModel()
 , fHistogram1(0)
 , fHistogram2(0)
 , fFitFunction(0)
 , fHistogramBinomial(0)
 , fDataPointType(1)
{
   // set default options and values
   MCMCSetNIterationsRun(2000);
   MCMCSetRValueCriterion(0.01);
   SetFillErrorBand();
   fFlagIntegration = false;
}
| BCEfficiencyFitter::BCEfficiencyFitter | ( | const char * | name | ) |
Constructor
- Parameters:
-
name name fo the model
Definition at line 48 of file BCEfficiencyFitter.cxx.
 : BCModel(name)
 , fHistogram1(0)
 , fHistogram2(0)
 , fFitFunction(0)
 , fHistogramBinomial(0)
 , fDataPointType(1)
{
   // set default options and values
   MCMCSetNIterationsRun(2000);
   MCMCSetRValueCriterion(0.01);
   SetFillErrorBand();
   fFlagIntegration = false;
}
| BCEfficiencyFitter::BCEfficiencyFitter | ( | TH1D * | hist1, | |
| TH1D * | hist2, | |||
| TF1 * | func | |||
| ) |
A constructor.
- Parameters:
-
hist1 The histogram with the larger numbers hist2 The histogram with the smaller numbers func The fit function.
Definition at line 65 of file BCEfficiencyFitter.cxx.
 : BCModel()
 , fHistogram1(0)
 , fHistogram2(0)
 , fFitFunction(0)
 , fHistogramBinomial(0)
 , fDataPointType(1)
{
   SetHistograms(hist1, hist2);
   SetFitFunction(func);

   MCMCSetNIterationsRun(2000);
   MCMCSetRValueCriterion(0.01);
   SetFillErrorBand();
   fFlagIntegration = false;
}
| BCEfficiencyFitter::BCEfficiencyFitter | ( | const char * | name, | |
| TH1D * | hist1, | |||
| TH1D * | hist2, | |||
| TF1 * | func | |||
| ) |
Constructor.
- Parameters:
-
name name fo the model hist1 The histogram with the larger numbers hist2 The histogram with the smaller numbers func The fit function.
Definition at line 84 of file BCEfficiencyFitter.cxx.
 : BCModel(name)
 , fHistogram1(0)
 , fHistogram2(0)
 , fFitFunction(0)
 , fHistogramBinomial(0)
 , fDataPointType(1)
{
   SetHistograms(hist1, hist2);
   SetFitFunction(func);

   MCMCSetNIterationsRun(2000);
   MCMCSetRValueCriterion(0.01);
   SetFillErrorBand();
   fFlagIntegration = false;
}
| BCEfficiencyFitter::~BCEfficiencyFitter | ( | ) |
The default destructor.
Definition at line 209 of file BCEfficiencyFitter.cxx.
{
   if (fHistogram1)
      delete fHistogram1;

   if (fHistogram2)
      delete fHistogram2;

   if (fHistogramBinomial)
      delete fHistogramBinomial;
}
Member Function Documentation
| int BCEfficiencyFitter::CalculatePValueFast | ( | const std::vector< double > & | par, | |
| double & | pvalue | |||
| ) |
Calculate the p-value using fast-MCMC.
- Parameters:
-
par A set of parameter values pvalue The pvalue
- Returns:
- An error code
Definition at line 443 of file BCEfficiencyFitter.cxx.
{
   // check size of parameter vector
   if (par.size() != GetNParameters()) {
      BCLog::OutError("BCEfficiencyFitter::CalculatePValueFast : Number of parameters is inconsistent.");
      return 0;
   }

   // check if histogram exists
   if (!fHistogram1 || !fHistogram2) {
      BCLog::OutError("BCEfficiencyFitter::CalculatePValueFast : Histogram not defined.");
      return 0;
   }

   // define temporary variables
   int nbins = fHistogram1->GetNbinsX();

   std::vector<int> histogram;
   std::vector<double> expectation;
   histogram.assign(nbins, 0);
   expectation.assign(nbins, 0);

   double logp = 0;
   double logp_start = 0;
   int counter_pvalue = 0;

   // define starting distribution
   for (int ibin = 0; ibin < nbins; ++ibin) {
      // get bin boundaries
      double xmin = fHistogram1->GetBinLowEdge(ibin+1);
      double xmax = fHistogram1->GetBinLowEdge(ibin+2);

      // get the number of expected events
      double yexp = fFitFunction->Integral(xmin, xmax);

      // get n
      int n = int(fHistogram1->GetBinContent(ibin));

      // get k
      int k = int(fHistogram2->GetBinContent(ibin));

      histogram[ibin]   = k;
      expectation[ibin] = n * yexp;

      // calculate p;
      logp += BCMath::LogApproxBinomial(n, k, yexp);
   }
   logp_start = logp;

   int niter = 100000;

   // loop over iterations
   for (int iiter = 0; iiter < niter; ++iiter)
   {
      // loop over bins
      for (int ibin = 0; ibin < nbins; ++ibin)
      {
         // get n
         int n = int(fHistogram1->GetBinContent(ibin));

         // get k
         int k = histogram.at(ibin);

         // get expectation
         double yexp = 0;
         if (n > 0)
            yexp = expectation.at(ibin)/n;

         // random step up or down in statistics for this bin
         double ptest = fRandom->Rndm() - 0.5;

         // continue, if efficiency is at limit
         if (!(yexp > 0. || yexp < 1.0))
            continue;

         // increase statistics by 1
         if (ptest > 0 && (k < n))
         {
            // calculate factor of probability
            double r = (double(n)-double(k))/(double(k)+1.) * yexp / (1. - yexp);

            // walk, or don't (this is the Metropolis part)
            if (fRandom->Rndm() < r)
            {
               histogram[ibin] = k + 1;
               logp += log(r);
            }
         }

         // decrease statistics by 1
         else if (ptest <= 0 && (k > 0))
         {
            // calculate factor of probability
            double r = double(k) / (double(n)-(double(k)-1)) * (1-yexp)/yexp;

            // walk, or don't (this is the Metropolis part)
            if (fRandom->Rndm() < r)
            {
               histogram[ibin] = k - 1;
               logp += log(r);
            }
         }

      } // end of looping over bins

      // increase counter
      if (logp < logp_start)
         counter_pvalue++;

   } // end of looping over iterations

   // calculate p-value
   pvalue = double(counter_pvalue) / double(niter);

   // no error
   return 1;
}
| void BCEfficiencyFitter::DrawFit | ( | const char * | options = "", |
|
| bool | flaglegend = false | |||
| ) |
Draw the fit in the current pad.
Definition at line 349 of file BCEfficiencyFitter.cxx.
{
   if (!fHistogram1 || !fHistogram2) {
      BCLog::OutError("BCEfficiencyFitter::DrawFit : Histogram(s) not defined.");
      return;
   }

   if (!fFitFunction) {
      BCLog::OutError("BCEfficiencyFitter::DrawFit : Fit function not defined.");
      return;
   }

   // create efficiency graph
   TGraphAsymmErrors * histRatio = new TGraphAsymmErrors();
   histRatio->SetMarkerStyle(20);
   histRatio->SetMarkerSize(1.5);

   int npoints = 0;

   // set points
   for (int i = 1; i <= fHistogram1->GetNbinsX(); ++i)
   {
      if(int(fHistogram1->GetBinContent(i)) == 0) {
         ++npoints;
         continue;
      }

      // calculate central value and uncertainties
      double xexp, xmin, xmax;
      GetUncertainties( int(fHistogram1->GetBinContent(i)), int(fHistogram2->GetBinContent(i)), 0.68, xexp, xmin, xmax);

      histRatio->SetPoint( npoints, fHistogram1->GetBinCenter(i), xexp);

      // no X uncertainties
      histRatio->SetPointEXhigh(npoints, 0.);
      histRatio->SetPointEXlow(npoints, 0.);

      // set Y uncertainties
      histRatio->SetPointEYhigh(npoints, xmax - xexp);
      histRatio->SetPointEYlow(npoints, xexp - xmin);

      ++npoints;
   }


   // check wheather options contain "same"
   TString opt = options;
   opt.ToLower();

   // if not same, draw the histogram first to get the axes
   if(!opt.Contains("same"))
   {
      // create new histogram
      TH2D * hist_axes = new TH2D("hist_axes",
            Form(";%s;ratio", fHistogram1->GetXaxis()->GetTitle()),
            fHistogram1->GetNbinsX(),
            fHistogram1->GetXaxis()->GetBinLowEdge(1),
            fHistogram1->GetXaxis()->GetBinLowEdge(fHistogram1->GetNbinsX()+1),
            1, 0., 1.);
      hist_axes->SetStats(kFALSE);
      hist_axes->Draw();

      histRatio->Draw(TString::Format("%sp",opt.Data()));
   }

   // draw the error band as central 68% probability interval
   fErrorBand = GetErrorBandGraph(0.16, 0.84);
   fErrorBand->Draw("f same");

   // now draw the histogram again since it was covered by the band
   histRatio->SetMarkerSize(.7);
   histRatio->Draw(TString::Format("%ssamep",opt.Data()));

   // draw the fit function on top
   fGraphFitFunction = GetFitFunctionGraph( GetBestFitParameters() );
   fGraphFitFunction->SetLineColor(kRed);
   fGraphFitFunction->SetLineWidth(2);
   fGraphFitFunction->Draw("l same");

   // draw legend
   if (flaglegend)
   {
      TLegend * legend = new TLegend(0.25, 0.75, 0.55, 0.95);
      legend->SetBorderSize(0);
      legend->SetFillColor(kWhite);
      legend->AddEntry(histRatio, "Data", "L");
      legend->AddEntry(fGraphFitFunction, "Best fit", "L");
      legend->AddEntry(fErrorBand, "Error band", "F");
      legend->Draw();
   }
   gPad->RedrawAxis();
}
| int BCEfficiencyFitter::Fit | ( | ) |
Performs the fit.
- Returns:
- An error code.
Definition at line 312 of file BCEfficiencyFitter.cxx.
{
   // set histogram
   if (!fHistogram1 || !fHistogram2) {
      BCLog::OutError("BCEfficiencyFitter::Fit : Histogram(s) not defined.");
      return 0;
   }

   // set function
   if (!fFitFunction) {
      BCLog::OutError("BCEfficiencyFitter::Fit : Fit function not defined.");
      return 0;
   }

   // perform marginalization
   MarginalizeAll();

   // maximize posterior probability, using the best-fit values close
   // to the global maximum from the MCMC
   FindModeMinuit( GetBestFitParameters() , -1);

   // calculate the p-value using the fast MCMC algorithm
   double pvalue;
   if ( CalculatePValueFast(GetBestFitParameters(), pvalue) )
      fPValue = pvalue;
   else
      BCLog::OutError("BCEfficiencyFitter::Fit : Could not use the fast p-value evaluation.");

   // print summary to screen
   PrintShortFitSummary();

   // no error
   return 1;
}
| int BCEfficiencyFitter::Fit | ( | TH1D * | hist1, | |
| TH1D * | hist2, | |||
| TF1 * | func | |||
| ) |
Performs the fit.
- Parameters:
-
hist1 The histogram with the larger number. hist2 The histogram with the smaller number. func The fit function.
- Returns:
- An error code.
Definition at line 289 of file BCEfficiencyFitter.cxx.
{
   // set histogram
   if (hist1 && hist2)
      SetHistograms(hist1, hist2);
   else {
      BCLog::OutError("BCEfficiencyFitter::Fit : Histogram(s) not defined.");
      return 0;
   }

   // set function
   if (func)
      SetFitFunction(func);
   else {
      BCLog::OutError("BCEfficiencyFitter::Fit : Fit function not defined.");
      return 0;
   }

   return Fit();
}
| double BCEfficiencyFitter::FitFunction | ( | const std::vector< double > & | x, | |
| const std::vector< double > & | parameters | |||
| ) | [virtual] |
Returns the y-value of the 1-dimensional fit function at an x and for a set of parameters.
- Parameters:
-
x A vector with the x-value. parameters A set of parameters.
Reimplemented from BCIntegrate.
Definition at line 279 of file BCEfficiencyFitter.cxx.
{
// set the parameters of the function
fFitFunction->SetParameters(¶ms[0]);
return fFitFunction->Eval(x[0]);
}
| TGraph* BCEfficiencyFitter::GetErrorBand | ( | ) | [inline] |
- Returns:
- pointer to the error band
Definition at line 99 of file BCEfficiencyFitter.h.
{ return fErrorBand; };
| TF1* BCEfficiencyFitter::GetFitFunction | ( | ) | [inline] |
- Returns:
- The fit function
Definition at line 94 of file BCEfficiencyFitter.h.
{ return fFitFunction; };
| TGraph* BCEfficiencyFitter::GetGraphFitFunction | ( | ) | [inline] |
- Returns:
- pointer to a graph for the fit function
Definition at line 104 of file BCEfficiencyFitter.h.
{ return fGraphFitFunction; };
| TH1D* BCEfficiencyFitter::GetHistogram1 | ( | ) | [inline] |
- Returns:
- The histogram 1
Definition at line 79 of file BCEfficiencyFitter.h.
{ return fHistogram1; };
| TH1D* BCEfficiencyFitter::GetHistogram2 | ( | ) | [inline] |
- Returns:
- The histogram 2
Definition at line 84 of file BCEfficiencyFitter.h.
{ return fHistogram2; };
| TGraphAsymmErrors* BCEfficiencyFitter::GetHistogramRatio | ( | ) | [inline] |
- Returns:
- The histogram ratio
Definition at line 89 of file BCEfficiencyFitter.h.
{ return fHistogramRatio; };
| int BCEfficiencyFitter::GetUncertainties | ( | int | n, | |
| int | k, | |||
| double | p, | |||
| double & | xexp, | |||
| double & | xmin, | |||
| double & | xmax | |||
| ) |
Calculates the central value and the lower and upper limits for a given probability.
- Parameters:
-
n n for the binomial. k k for the binomial. p The central probability defining the limits. xmin The central value. xmin The lower limit. xmax The upper limit.
- Returns:
- A flag (=1 plot point, !=1 do not plot point).
Definition at line 562 of file BCEfficiencyFitter.cxx.
{
   if (n == 0)
   {
      xexp = 0.;
      xmin = 0.;
      xmax = 0.;
      return 0;
   }

   BCLog::OutDebug(Form("Calculating efficiency data-point of type %d for (n,k) = (%d,%d)",fDataPointType,n,k));

   // create a histogram with binomial distribution
   if (fHistogramBinomial)
      fHistogramBinomial->Reset();
   else
      fHistogramBinomial = new TH1D("hist_binomial", "", 1000, 0., 1.);

   // loop over bins and fill histogram
   for (int i = 1; i <= 1000; ++i) {
      double x   = fHistogramBinomial->GetBinCenter(i);
      double val = BCMath::ApproxBinomial(n, k, x);
      fHistogramBinomial->SetBinContent(i, val);
   }

   // normalize
   fHistogramBinomial->Scale(1. / fHistogramBinomial->Integral());

   // calculate central value and uncertainties
   if (fDataPointType == 0) {
      xexp = fHistogramBinomial->GetMean();
      double rms = fHistogramBinomial->GetRMS();
      xmin = xexp-rms;
      xmax = xexp+rms;
      BCLog::OutDebug(Form(" - mean = %f , rms = %f)",xexp,rms));
   }
   else if (fDataPointType == 1) {
      xexp = (double)k/(double)n;
      BCH1D * fbh = new BCH1D((TH1D*)fHistogramBinomial->Clone("hcp"));
      std::vector<double> intervals = fbh->GetSmallestIntervals(p);
      int ninter = intervals.size();
      if ( ninter<2 ) {
         xmin = xmax = xexp = 0.;
      }
      else {
         xmin = intervals[0];
         xmax = intervals[1];
      }
      delete fbh;
   }
   else {
      // calculate quantiles
      int nprobSum = 3;
      double q[3];
      double probSum[3];
      probSum[0] = (1.-p)/2.;
      probSum[1] = 1.-(1.-p)/2.;
      probSum[2] = .5;

      fHistogramBinomial->GetQuantiles(nprobSum, q, probSum);

      xexp = q[2];
      xmin = q[0];
      xmax = q[1];

   }

   BCLog::OutDebug(Form(" - efficiency = %f , range (%f - %f)",xexp,xmin,xmax));

   return 1;
}
| double BCEfficiencyFitter::LogLikelihood | ( | const std::vector< double > & | parameters | ) | [virtual] |
The log of the prior probability. Overloaded from BCModel.
- Parameters:
-
parameters A vector of doubles containing the parameter values. The log of the conditional probability. Overloaded from BCModel. parameters A vector of doubles containing the parameter values.
Implements BCModel.
Definition at line 233 of file BCEfficiencyFitter.cxx.
{
// initialize probability
double loglikelihood = 0;
// set the parameters of the function
fFitFunction->SetParameters(¶ms[0]);
// get the number of bins
int nbins = fHistogram1->GetNbinsX();
// get bin width
double dx = fHistogram1->GetXaxis()->GetBinWidth(0);
// loop over all bins
for (int ibin = 1; ibin <= nbins; ++ibin)
{
// get n
int n = int(fHistogram1->GetBinContent(ibin));
// get k
int k = int(fHistogram2->GetBinContent(ibin));
// get x
double x = fHistogram1->GetBinCenter(ibin);
double eff = 0;
// use ROOT's TH1D::Integral method
if (fFlagIntegration)
eff = fFitFunction->Integral(x - dx/2., x + dx/2.) / dx;
// use linear interpolation
else
eff = (fFitFunction->Eval(x + dx/2.) + fFitFunction->Eval(x - dx/2.)) / 2.;
// get the value of the Poisson distribution
loglikelihood += BCMath::LogApproxBinomial(n, k, eff);
}
return loglikelihood;
}
| void BCEfficiencyFitter::SetDataPointType | ( | int | type | ) |
Set type of point to be used to plot the efficiency data 0 - mean + rms 1 - mode + smallest 68% 2 - median + central 68%
Definition at line 223 of file BCEfficiencyFitter.cxx.
{
   if(type < 0 || type > 2)
      BCLog::OutError(Form("BCEfficiencyFitter::SetDataPointType : Unknown data point type %d (should be between 0 and 2).",type));
   else
      fDataPointType = type;
}
| int BCEfficiencyFitter::SetFitFunction | ( | TF1 * | func | ) |
- Parameters:
-
func The fit function
- Returns:
- An error code (1:pass, 0:fail).
Definition at line 169 of file BCEfficiencyFitter.cxx.
{
   // check if function exists
   if(!func) {
      BCLog::OutError("BCEfficiencyFitter::SetFitFunction : TF1 not created.");
      return 0;
   }

   // set the function
   fFitFunction = func;

   // update the model name to contain the function name
   if(fName=="model")
      SetName(TString::Format("BCEfficiencyFitter with %s",fFitFunction->GetName()));

   // reset parameters
   fParameterSet->clear();

   // get the new number of parameters
   int n = func->GetNpar();

   // add parameters
   for (int i = 0; i < n; ++i)
   {
      double xmin;
      double xmax;

      func->GetParLimits(i, xmin, xmax);

      AddParameter(func->GetParName(i), xmin, xmax);
   }

   // set flat prior for all parameters by default
   SetPriorConstantAll();

   return GetNParameters();;
}
| void BCEfficiencyFitter::SetFlagIntegration | ( | bool | flag | ) | [inline] |
Sets the flag for integration.
true: use ROOT's TH1D::Integrate()
false: use linear interpolation
Definition at line 137 of file BCEfficiencyFitter.h.
{ fFlagIntegration = flag; };
| int BCEfficiencyFitter::SetHistograms | ( | TH1D * | hist1, | |
| TH1D * | hist2 | |||
| ) |
- Parameters:
-
hist The histogram 1 hist The histogram 2
- Returns:
- An error code (1:pass, 0:fail).
Definition at line 103 of file BCEfficiencyFitter.cxx.
{
   // check if histogram exists
   if (!hist1 || !hist2) {
      BCLog::OutError("BCEfficiencyFitter::SetHistograms : TH1D not created.");
      return 0;
   }

   // check compatibility of both histograms : number of bins
   if (hist1->GetNbinsX() != hist2->GetNbinsX()) {
      BCLog::OutError("BCEfficiencyFitter::SetHistograms : Histograms do not have the same number of bins.");
      return 0;
   }

   // check compatibility of both histograms : bin content
   for (int i = 1; i <= hist1->GetNbinsX(); ++i)
      if (hist1->GetBinContent(i) < hist2->GetBinContent(i)) {
         BCLog::OutError("BCEfficiencyFitter::SetHistograms : Histogram 1 has fewer entries than histogram 2.");
         return 0;
      }

   // set pointer to histograms
   fHistogram1 = hist1;
   fHistogram2 = hist2;

   // create a data set. this is necessary in order to calculate the
   // error band. the data set contains as many data points as there
   // are bins. for now, the data points are empty.
   BCDataSet * ds = new BCDataSet();

   // create data points and add them to the data set.
   int nbins = fHistogram1->GetNbinsX();
   for (int i = 0; i < nbins; ++i) {
      BCDataPoint* dp = new BCDataPoint(2);
      ds->AddDataPoint(dp);
   }

   // set the new data set.
   SetDataSet(ds);

   // calculate the lower and upper edge in x.
   double xmin = hist1->GetBinLowEdge(1);
   double xmax = hist1->GetBinLowEdge(nbins+1);

//   // calculate the minimum and maximum range in y.
//   double histymin = hist2->GetMinimum();
//   double histymax = hist1->GetMaximum();

//   // calculate the minimum and maximum of the function value based on
//   // the minimum and maximum value in y.
//   double ymin = TMath::Max(0., histymin - 5.*sqrt(histymin));
//   double ymax = histymax + 5.*sqrt(histymax);

   // set the data boundaries for x and y values.
   SetDataBoundaries(0, xmin, xmax);
   SetDataBoundaries(1, 0.0, 1.0);

   // set the indeces for fitting.
   SetFitFunctionIndices(0, 1);

   // no error
   return 1;
}
Member Data Documentation
unsigned int BCEfficiencyFitter::fDataPointType [private] |
Type of point to plot for efficiency data 0 - mean + rms 1 - mode + smallest 68% 2 - median + central 68%
Definition at line 232 of file BCEfficiencyFitter.h.
TGraph* BCEfficiencyFitter::fErrorBand [private] |
Pointer to the error band (for legend)
Definition at line 218 of file BCEfficiencyFitter.h.
TF1* BCEfficiencyFitter::fFitFunction [private] |
The fit function
Definition at line 209 of file BCEfficiencyFitter.h.
bool BCEfficiencyFitter::fFlagIntegration [private] |
Flag for using the ROOT TH1D::Integral method (true), or linear interpolation (false)
Definition at line 214 of file BCEfficiencyFitter.h.
TGraph* BCEfficiencyFitter::fGraphFitFunction [private] |
Pointer to a graph for displaying the fit function
Definition at line 222 of file BCEfficiencyFitter.h.
TH1D* BCEfficiencyFitter::fHistogram1 [private] |
The histogram containing the larger numbers.
Definition at line 197 of file BCEfficiencyFitter.h.
TH1D* BCEfficiencyFitter::fHistogram2 [private] |
The histogram containing the smaller numbers.
Definition at line 201 of file BCEfficiencyFitter.h.
TH1D* BCEfficiencyFitter::fHistogramBinomial [private] |
Temporary histogram for calculating the binomial qunatiles
Definition at line 226 of file BCEfficiencyFitter.h.
TGraphAsymmErrors* BCEfficiencyFitter::fHistogramRatio [private] |
The efficiency histogram.
Definition at line 205 of file BCEfficiencyFitter.h.
The documentation for this class was generated from the following files: