A class for fitting histograms with functions. More...
#include <BCHistogramFitter.h>
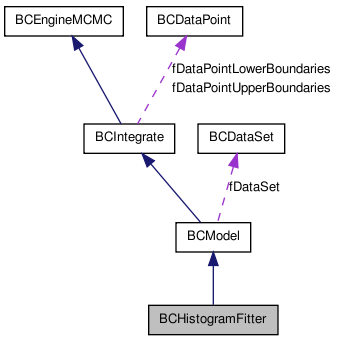
Inherits BCModel.
Public Member Functions | |
Constructors and destructors | |
| BCHistogramFitter () | |
| BCHistogramFitter (const char *name) | |
| BCHistogramFitter (TH1D *hist, TF1 *func) | |
| BCHistogramFitter (const char *name, TH1D *hist, TF1 *func) | |
| ~BCHistogramFitter () | |
Member functions (get) | |
| TH1D * | GetHistogram () |
| TH1D * | GetHistogramExpected () |
| TF1 * | GetFitFunction () |
| TGraph * | GetErrorBand () |
| TGraph * | GetGraphFitFunction () |
Member functions (set) | |
| int | SetHistogram (TH1D *hist) |
| int | SetHistogramExpected (const std::vector< double > ¶meters) |
| int | SetFitFunction (TF1 *func) |
| void | SetFlagIntegration (bool flag) |
Member functions (miscellaneous methods) | |
| virtual double | LogLikelihood (const std::vector< double > ¶meters) |
| double | FitFunction (const std::vector< double > &x, const std::vector< double > ¶meters) |
| int | Fit () |
| int | Fit (TH1D *hist, TF1 *func) |
| void | DrawFit (const char *options="HIST", bool flaglegend=false) |
| int | CalculatePValueFast (const std::vector< double > &par, double &pvalue, int nIterations=100000) |
| int | CalculatePValueFast (const std::vector< double > &par, BCHistogramFitterToyDataInterface *callback, double &pvalue, int nIterations=100000) |
| int | CalculatePValueLikelihood (const std::vector< double > &par, double &pvalue) |
| int | CalculatePValueLeastSquares (const std::vector< double > &par, double &pvalue, bool weightExpect=true) |
| int | CalculatePValueKolmogorov (const std::vector< double > &par, double &pvalue) |
| double | CDF (const std::vector< double > ¶meters, int index, bool lower=false) |
Private Attributes | |
| TH1D * | fHistogram |
| TF1 * | fFitFunction |
| bool | fFlagIntegration |
| TGraph * | fErrorBand |
| TGraph * | fGraphFitFunction |
| TH1D * | fHistogramExpected |
Detailed Description
A class for fitting histograms with functions.
- Version:
- 1.0
- Date:
- 11.2008 This class allows fitting of a TH1D histogram using a TF1 function.
Definition at line 36 of file BCHistogramFitter.h.
Constructor & Destructor Documentation
| BCHistogramFitter::BCHistogramFitter | ( | ) |
The default constructor.
Definition at line 30 of file BCHistogramFitter.cxx.
 : BCModel()
 , fHistogram(0)
 , fFitFunction(0)
 , fHistogramExpected(0)
{
   // set default options and values
   MCMCSetNIterationsRun(2000);
   SetFillErrorBand();
   fFlagIntegration = true;
   flag_discrete = true;
}
| BCHistogramFitter::BCHistogramFitter | ( | const char * | name | ) |
Constructor
- Parameters:
-
name name of the model
Definition at line 45 of file BCHistogramFitter.cxx.
 : BCModel(name)
 , fHistogram(0)
 , fFitFunction(0)
 , fHistogramExpected(0)
{
   // set default options and values
   MCMCSetNIterationsRun(2000);
   SetFillErrorBand();
   fFlagIntegration = true;
   flag_discrete = true;
}
| BCHistogramFitter::BCHistogramFitter | ( | TH1D * | hist, | |
| TF1 * | func | |||
| ) |
Constructor.
- Parameters:
-
hist histogram to fit func fit function
Definition at line 60 of file BCHistogramFitter.cxx.
 : BCModel()
 , fHistogram(0)
 , fFitFunction(0)
 , fHistogramExpected(0)
{
   SetHistogram(hist);
   SetFitFunction(func);

   MCMCSetNIterationsRun(2000);
   SetFillErrorBand();
   fFlagIntegration = true;
   flag_discrete = true;
}
| BCHistogramFitter::BCHistogramFitter | ( | const char * | name, | |
| TH1D * | hist, | |||
| TF1 * | func | |||
| ) |
Constructor
- Parameters:
-
name name of the model hist histogram to fit func fit function
Definition at line 77 of file BCHistogramFitter.cxx.
 : BCModel(name)
 , fHistogram(0)
 , fFitFunction(0)
 , fHistogramExpected(0)
{
   SetHistogram(hist);
   SetFitFunction(func);

   MCMCSetNIterationsRun(2000);
   SetFillErrorBand();
   fFlagIntegration = true;
   flag_discrete = true;
}
| BCHistogramFitter::~BCHistogramFitter | ( | ) |
The default destructor.
Definition at line 247 of file BCHistogramFitter.cxx.
{
   delete fHistogramExpected;
}
Member Function Documentation
| int BCHistogramFitter::CalculatePValueFast | ( | const std::vector< double > & | par, | |
| double & | pvalue, | |||
| int | nIterations = 100000 | |||
| ) |
Calculate the p-value using fast-MCMC and the likelihood as test statistic. The method is explained in the appendix of http://arxiv.org/abs/1011.1674
- Parameters:
-
par A set of parameter values pvalue The p-value nIterations number of pseudo experiments generated by the Markov chain
- Returns:
- An error code
Definition at line 456 of file BCHistogramFitter.cxx.
{
   //use NULL pointer for no callback
   return CalculatePValueFast(par, 0, pvalue,  nIterations);
}
| int BCHistogramFitter::CalculatePValueFast | ( | const std::vector< double > & | par, | |
| BCHistogramFitterToyDataInterface * | callback, | |||
| double & | pvalue, | |||
| int | nIterations = 100000 | |||
| ) |
Calculate the p-value using fast-MCMC. In every iteration, a new toy data set is created. By providing a suitable implementation of BCHistogramFitterToyDataInterface, the user can calculate the distribution of an arbitrary statistic. Each toy data set as well as the expected values for the parameter values are passed on to the interface.
- Parameters:
-
par A set of parameter values pvalue The p-value for the default likelihood statistic callback requires class with operator(...) defined. nIterations number of toy data sets generated by the Markov chain
- Returns:
- An error code
Definition at line 463 of file BCHistogramFitter.cxx.
{
   // check size of parameter vector
   if (par.size() != GetNParameters()) {
      BCLog::OutError(
            "BCHistogramFitter::CalculatePValueFast : Number of parameters is inconsistent.");
      return 0;
   }

   // check if histogram exists
   if (!fHistogram) {
      BCLog::OutError(
            "BCHistogramFitter::CalculatePValueFast : Histogram not defined.");
      return 0;
   }

   // define temporary variables
   int nbins = fHistogram->GetNbinsX();

   std::vector<int> histogram;
   std::vector<double> expectation;
   histogram.assign(nbins, 0);
   expectation.assign(nbins, 0);

   double logp = 0;
   double logp_start = 0;
   int counter_pvalue = 0;

   //update the expected number of events for all bins
   SetHistogramExpected(par);

   // define starting distribution as histogram with most likely entries
   for (int ibin = 0; ibin < nbins; ++ibin) {

      // get the number of expected events
      double yexp = fHistogramExpected->GetBinContent(ibin + 1);

      //most likely observed value = int(expected value)
      histogram[ibin] = int(yexp);
      expectation[ibin] = yexp;

      // calculate test statistic (= likelihood of entire histogram) for starting distr.
      logp += BCMath::LogPoisson(double(int(yexp)), yexp);
      //statistic of the observed data set
      logp_start += BCMath::LogPoisson(fHistogram->GetBinContent(ibin + 1),
            yexp);
   }

   // loop over iterations
   for (int iiter = 0; iiter < nIterations; ++iiter) {
      // loop over bins
      for (int ibin = 0; ibin < nbins; ++ibin) {
         // random step up or down in statistics for this bin
         double ptest = fRandom->Rndm() - 0.5;

         // increase statistics by 1
         if (ptest > 0) {
            // calculate factor of probability
            double r = expectation.at(ibin) / double(histogram.at(ibin) + 1);

            // walk, or don't (this is the Metropolis part)
            if (fRandom->Rndm() < r) {
               histogram[ibin] = histogram.at(ibin) + 1;
               logp += log(r);
            }
         }

         // decrease statistics by 1
         else if (ptest <= 0 && histogram[ibin] > 0) {
            // calculate factor of probability
            double r = double(histogram.at(ibin)) / expectation.at(ibin);

            // walk, or don't (this is the Metropolis part)
            if (fRandom->Rndm() < r) {
               histogram[ibin] = histogram.at(ibin) - 1;
               logp += log(r);
            }
         }
      } // end of looping over bins

      //one new toy data set is created
      //call user interface to calculate arbitrary statistic's distribution
      if (callback)
         (*callback)(expectation, histogram);

      // increase counter
      if (logp < logp_start)
         counter_pvalue++;

   } // end of looping over iterations

   // calculate p-value
   pvalue = double(counter_pvalue) / double(nIterations);

   // no error
   return 1;
}
| int BCHistogramFitter::CalculatePValueKolmogorov | ( | const std::vector< double > & | par, | |
| double & | pvalue | |||
| ) |
Calculate the p-value using Kolmogorov-Smirnov test. Note that the reference distribution is known only asymptotically. Some explanation is given in http://root.cern.ch/root/htmldoc/TMath.html
- Parameters:
-
par The set of parameter values used in the model, usually the best fit parameters pvalue The pvalue
- Returns:
- An error code
Definition at line 643 of file BCHistogramFitter.cxx.
{
   if (!fHistogramExpected || !fHistogram) {
      BCLog::OutError("BCHistogramFitter::CalculatePValueKolmogorov: "
         "Please define the reference distribution by calling \n"
         "BCHistogramFitter::SetHistogramExpected() first!");
      return 0;
   }

   //update expected counts with current parameters
   SetHistogramExpected(par);

   //perform the test
   pvalue = fHistogramExpected->KolmogorovTest(fHistogram);

   fPValue = pvalue;

   // no error
   return 1;
}
| int BCHistogramFitter::CalculatePValueLeastSquares | ( | const std::vector< double > & | par, | |
| double & | pvalue, | |||
| bool | weightExpect = true | |||
| ) |
Calculate the p-value using approximate chi^2 distribution of squared difference for conventional weights. Approximation is valid for bin contents >5 and not as as good for little data as CalculatePValueLikelihood, see eq. (32.13), PDG: Statistics, Monte Carlo, Group Theory. Physics Letters B 667, 316-339(2008).
- Parameters:
-
par The set of parameter values used in the model, usually the best fit parameters pvalue The pvalue weight use the variance from the expected counts (true) or the measured counts (false)
- Returns:
- An error code
Definition at line 603 of file BCHistogramFitter.cxx.
{
   // initialize test statistic chi^2
   double chi2 = 0.0;

   //Calculate expected counts to compare with
   SetHistogramExpected(par);

   for (int ibin = 1; ibin <= fHistogram->GetNbinsX(); ++ibin) {

      // get the number of observed events
      double y = fHistogram->GetBinContent(ibin);

      // get the number of expected events
      double yexp = fHistogramExpected->GetBinContent(ibin);

      //convert 1/0.0 into 1 for weighted sum
      double weight;
      if (weightExpect)
         weight = (yexp > 0) ? yexp : 1.0;
      else
         weight = (y > 0) ? y : 1.0;

      // get the contribution from this datapoint
      chi2 += (y - yexp) * (y - yexp) / weight;
   }

   // compute degrees of freedom for Poisson case
   int nDoF = GetNDataPoints() - GetNParameters();

   // p value from chi^2 distribution, returns zero if logLambda < 0
   fPValueNDoF = TMath::Prob(chi2, nDoF);
   pvalue = fPValueNDoF;

   // no error
   return 1;
}
| int BCHistogramFitter::CalculatePValueLikelihood | ( | const std::vector< double > & | par, | |
| double & | pvalue | |||
| ) |
Calculate the p-value using approximate chi^2 distribution of scaled likelihood. Approximation is valid for bin contents >5, see eq. (32.12), PDG: Statistics, Monte Carlo, Group Theory. Physics Letters B 667, 316-339(2008).
- Parameters:
-
par The set of parameter values used in the model, usually the best fit parameters pvalue The pvalue
- Returns:
- An error code
Definition at line 564 of file BCHistogramFitter.cxx.
{
   // initialize test statistic -2*lambda
   double logLambda = 0.0;

   //Calculate expected counts to compare with
   SetHistogramExpected(par);

   for (int ibin = 1; ibin <= fHistogram->GetNbinsX(); ++ibin) {

      // get the number of observed events
      double y = fHistogram->GetBinContent(ibin);

      // get the number of expected events
      double yexp = fHistogramExpected->GetBinContent(ibin);

      // get the contribution from this datapoint
      if (y == 0)
         logLambda += yexp;
      else
         logLambda += yexp - y + y * log(y / yexp);
   }

   // rescale
   logLambda *= 2.0;

   // compute degrees of freedom for Poisson case
   int nDoF = GetNDataPoints() - GetNParameters();

   //p value from chi^2 distribution, returns zero if logLambda < 0
   fPValueNDoF = TMath::Prob(logLambda, nDoF);
   pvalue = fPValueNDoF;

   // no error
   return 1;
}
| double BCHistogramFitter::CDF | ( | const std::vector< double > & | , | |
| int | , | |||
| bool | = false | |||
| ) | [virtual] |
1dim cumulative distribution function of the probability to get the data f(x_i|param) for a single measurement, assumed to be of identical functional form for all measurements
- Parameters:
-
parameters The parameter values at which point to compute the cdf index The data point index starting at 0,1...N-1 lower only needed for discrete distributions! Return the CDF for the count one less than actually observed, e.g. in Poisson process, if 3 actually observed, then CDF(2) is returned
Reimplemented from BCModel.
Definition at line 666 of file BCHistogramFitter.cxx.
{
if (parameters.empty())
BCLog::OutWarning("BCHistogramFitter::CDF: parameter vector empty!");
//histogram stores underflow in bin 0, so datapoint 0 is in bin 1
index++;
// get the number of observed events (should be integer)
double yObs = fHistogram->GetBinContent(index);
// if(double( (unsigned int)yObs)==yObs)
// BCLog::OutWarning(Form(
// "BCHistogramFitter::CDF: using bin count %f that is not an integer!",yObs));
// get function value of lower bin edge
double edgeLow = fHistogram->GetBinLowEdge(index);
double edgeHigh = edgeLow + fHistogram->GetBinWidth(index);
// expectation value of this bin
double yExp = 0.0;
// use ROOT's TH1D::Integral method
if (fFlagIntegration)
yExp = fFitFunction->Integral(edgeLow, edgeHigh, ¶meters[0]);
// use linear interpolation
else {
double dx = fHistogram->GetBinWidth(index);
double fEdgeLow = fFitFunction->Eval(edgeLow);
double fEdgeHigh = fFitFunction->Eval(edgeHigh);
yExp = fEdgeLow * dx + (fEdgeHigh - fEdgeLow) * dx / 2.;
}
// usually Poisson bins do not agree with fixed probability bins
// so choose where it should belong
if (lower) {
if ((int) yObs >= 1)
return ROOT::Math::poisson_cdf((unsigned int) (yObs - 1), yExp);
else
return 0.0;
}
// what if yObs as double doesn't reprepsent a whole number? exceptioN?
if ((double) (unsigned int) yObs != yObs) {
BCLog::OutWarning(Form(
"BCHistogramFitter::CDF: Histogram values should be integer!\n"
" Bin %d = %f", index, yObs));
//convert randomly to integer
// ex. yObs = 9.785 =>
// yObs --> 10 with P = 78.5%
// yObs --> 9 with P = 21.5%
double U = fRandom->Rndm();
double yObsLower = (unsigned int) yObs;
if (U > (yObs - yObsLower))
yObs = yObsLower;
else
yObs = yObsLower + 1;
}
// BCLog::OutDebug(Form("yExp= %f yObs= %f par2=%",yExp, yObs,parameters.at(2)));
// BCLog::Out(TString::Format("yExp= %f yObs= %f par2=%",yExp, yObs,parameters.at(2)));
return ROOT::Math::poisson_cdf((unsigned int) yObs, yExp);
}
| void BCHistogramFitter::DrawFit | ( | const char * | options = "HIST", |
|
| bool | flaglegend = false | |||
| ) |
Draw the fit in the current pad.
Definition at line 403 of file BCHistogramFitter.cxx.
{
   if (!fHistogram) {
      BCLog::OutError("BCHistogramFitter::DrawFit : Histogram not defined.");
      return;
   }

   if (!fFitFunction) {
      BCLog::OutError("BCHistogramFitter::DrawFit : Fit function not defined.");
      return;
   }

   if (!fErrorBandXY || fBestFitParameters.empty()) {
      BCLog::OutError("BCHistogramFitter::DrawFit : Fit not performed yet.");
      return;
   }

   // check wheather options contain "same"
   TString opt = options;
   opt.ToLower();

   // if not same, draw the histogram first to get the axes
   if (!opt.Contains("same"))
      fHistogram->Draw(opt.Data());

   // draw the error band as central 68% probability interval
   fErrorBand = GetErrorBandGraph(0.16, 0.84);
   fErrorBand->Draw("f same");

   // now draw the histogram again since it was covered by the band
   fHistogram->Draw(TString::Format("%ssame", opt.Data()));

   // draw the fit function on top
   fGraphFitFunction = GetFitFunctionGraph(GetBestFitParameters());
   fGraphFitFunction->SetLineColor(kRed);
   fGraphFitFunction->SetLineWidth(2);
   fGraphFitFunction->Draw("l same");

   // draw legend
   if (flaglegend) {
      TLegend * legend = new TLegend(0.25, 0.75, 0.55, 0.95);
      legend->SetBorderSize(0);
      legend->SetFillColor(kWhite);
      legend->AddEntry(fHistogram, "Data", "L");
      legend->AddEntry(fGraphFitFunction, "Best fit", "L");
      legend->AddEntry(fErrorBand, "Error band", "F");
      legend->Draw();
   }

   gPad->RedrawAxis();
}
| int BCHistogramFitter::Fit | ( | TH1D * | hist, | |
| TF1 * | func | |||
| ) |
Performs the fit.
- Parameters:
-
hist The histogram (TH1D). func The fit function.
- Returns:
- An error code.
Definition at line 342 of file BCHistogramFitter.cxx.
{
   // set histogram
   if (hist)
      SetHistogram(hist);
   else {
      BCLog::OutError("BCHistogramFitter::Fit : Histogram not defined.");
      return 0;
   }

   // set function
   if (func)
      SetFitFunction(func);
   else {
      BCLog::OutError("BCHistogramFitter::Fit : Fit function not defined.");
      return 0;
   }

   return Fit();
}
| int BCHistogramFitter::Fit | ( | ) |
Performs the fit.
- Returns:
- An error code.
Definition at line 365 of file BCHistogramFitter.cxx.
{
   // set histogram
   if (!fHistogram) {
      BCLog::OutError("BCHistogramFitter::Fit : Histogram not defined.");
      return 0;
   }

   // set function
   if (!fFitFunction) {
      BCLog::OutError("BCHistogramFitter::Fit : Fit function not defined.");
      return 0;
   }

   // perform marginalization
   MarginalizeAll();

   // maximize posterior probability, using the best-fit values close
   // to the global maximum from the MCMC
   FindModeMinuit(GetBestFitParameters(), -1);

   // calculate the p-value using the fast MCMC algorithm
   double pvalue;
   if (CalculatePValueFast(GetBestFitParameters(), pvalue))
      fPValue = pvalue;
   else
      BCLog::OutWarning(
            "BCHistogramFitter::Fit : Could not use the fast p-value evaluation.");

   // print summary to screen
   PrintShortFitSummary();

   // no error
   return 1;
}
| double BCHistogramFitter::FitFunction | ( | const std::vector< double > & | x, | |
| const std::vector< double > & | parameters | |||
| ) | [virtual] |
Plots the histogram
- Parameters:
-
options Options for plotting. filename Name of the file which the histogram is printed into. The following options are available:
F : plots the fit function on top of the data E0 : plots the fit function and the 68% prob. uncertainty band of the fit function on top of the data E1 : plots the expectation from the fit function and the uncertainty bin-by-bin as error bars. Returns the y-value of the 1-dimensional fit function at an x and for a set of parameters.x A vector with the x-value. parameters A set of parameters.
Reimplemented from BCIntegrate.
Definition at line 332 of file BCHistogramFitter.cxx.
{
// set the parameters of the function
fFitFunction->SetParameters(¶ms[0]);
return fFitFunction->Eval(x[0]) * fHistogram->GetBinWidth(fHistogram->FindBin(x[0]));
}
| TGraph* BCHistogramFitter::GetErrorBand | ( | ) | [inline] |
- Returns:
- pointer to the error band
Definition at line 92 of file BCHistogramFitter.h.
{ return fErrorBand; };
| TF1* BCHistogramFitter::GetFitFunction | ( | ) | [inline] |
- Returns:
- The fit function
Definition at line 87 of file BCHistogramFitter.h.
{ return fFitFunction; };
| TGraph* BCHistogramFitter::GetGraphFitFunction | ( | ) | [inline] |
- Returns:
- pointer to a graph for the fit function
Definition at line 97 of file BCHistogramFitter.h.
{ return fGraphFitFunction; };
| TH1D* BCHistogramFitter::GetHistogram | ( | ) | [inline] |
- Returns:
- The data histogram
Definition at line 76 of file BCHistogramFitter.h.
{ return fHistogram; };
| TH1D* BCHistogramFitter::GetHistogramExpected | ( | ) | [inline] |
- Returns:
- The histogram of expected counts
Definition at line 81 of file BCHistogramFitter.h.
{ return fHistogramExpected; };
| double BCHistogramFitter::LogLikelihood | ( | const std::vector< double > & | parameters | ) | [virtual] |
The log of the prior probability. Overloaded from BCModel.
- Parameters:
-
parameters A vector of doubles containing the parameter values. The log of the conditional probability. Overloaded from BCModel. parameters A vector of doubles containing the parameter values.
Implements BCModel.
Definition at line 268 of file BCHistogramFitter.cxx.
{
// initialize probability
double loglikelihood = 0;
// set the parameters of the function
fFitFunction->SetParameters(¶ms[0]);
// get the number of bins
int nbins = fHistogram->GetNbinsX();
// get bin width
double dx = fHistogram->GetBinWidth(1);
// get function value of lower bin edge
double fedgelow = fFitFunction->Eval(fHistogram->GetBinLowEdge(1));
// loop over all bins
for (int ibin = 1; ibin <= nbins; ++ibin) {
// get upper bin edge
double xedgehi = fHistogram->GetBinLowEdge(ibin) + dx;
// get function value at upper bin edge
double fedgehi = fFitFunction->Eval(xedgehi);
// get the number of observed events
double y = fHistogram->GetBinContent(ibin);
double yexp = 0.;
// use ROOT's TH1D::Integral method
if (fFlagIntegration)
yexp = fFitFunction->Integral(xedgehi - dx, xedgehi);
// use linear interpolation
else {
yexp = fedgelow * dx + (fedgehi - fedgelow) * dx / 2.;
// make the upper edge the lower edge for the next iteration
fedgelow = fedgehi;
}
// get the value of the Poisson distribution
loglikelihood += BCMath::LogPoisson(y, yexp);
}
// // get bin boundaries
// double xmin = fHistogram->GetBinLowEdge(ibin);
// double xmax = fHistogram->GetBinLowEdge(ibin+1);
// // get the number of observed events
// double y = fHistogram->GetBinContent(ibin);
// // get the number of expected events
// double yexp = fFitFunction->Integral(xmin, xmax);
// // get the value of the Poisson distribution
// loglikelihood += BCMath::LogPoisson(y, yexp);
return loglikelihood;
}
| int BCHistogramFitter::SetFitFunction | ( | TF1 * | func | ) |
- Parameters:
-
func The fit function
- Returns:
- An error code (1:pass, 0:fail).
Definition at line 208 of file BCHistogramFitter.cxx.
{
   // check if function exists
   if (!func) {
      BCLog::OutError("BCHistogramFitter::SetFitFunction : TF1 not created.");
      return 0;
   }

   // set the function
   fFitFunction = func;

   // update the model name to contain the function name
   if(fName=="model")
      SetName(TString::Format("HistogramFitter with %s", fFitFunction->GetName()));

   // reset parameters
   fParameterSet->clear();

   // get the new number of parameters
   int n = func->GetNpar();

   // add parameters
   for (int i = 0; i < n; ++i) {
      double xmin;
      double xmax;

      func->GetParLimits(i, xmin, xmax);

      AddParameter(func->GetParName(i), xmin, xmax);
   }

   // set flat prior for all parameters by default
   SetPriorConstantAll();

   return GetNParameters();
}
| void BCHistogramFitter::SetFlagIntegration | ( | bool | flag | ) | [inline] |
Sets the flag for integration.
true: use ROOT's TH1D::Integrate()
false: use linear interpolation
Definition at line 127 of file BCHistogramFitter.h.
{ fFlagIntegration = flag; };
| int BCHistogramFitter::SetHistogram | ( | TH1D * | hist | ) |
- Parameters:
-
hist The histogram containing the data
- Returns:
- An error code (1:pass, 0:fail).
Definition at line 94 of file BCHistogramFitter.cxx.
{
   // check if histogram exists
   if (!hist) {
      BCLog::OutError("BCHistogramFitter::SetHistogram : TH1D not created.");
      return 0;
   }

   // set pointer to histogram
   fHistogram = hist;

   // create a data set. this is necessary in order to calculate the
   // error band. the data set contains as many data points as there
   // are bins.
   BCDataSet * ds = new BCDataSet();

   // create data points and add them to the data set.
   // the x value is the lower edge of the bin, and
   // the y value is the bin count
   int nbins = fHistogram->GetNbinsX();
   for (int i = 0; i < nbins; ++i) {
      BCDataPoint* dp = new BCDataPoint(2);
      dp ->SetValue(0, fHistogram->GetBinLowEdge(i + 1));
      dp ->SetValue(1, fHistogram->GetBinContent(i + 1));
      ds->AddDataPoint(dp);
   }

   // set the new data set.
   SetDataSet(ds);

   // calculate the lower and upper edge in x.
   double xmin = hist->GetBinLowEdge(1);
   double xmax = hist->GetBinLowEdge(nbins + 1);

   // calculate the minimum and maximum range in y.
   double histymin = hist->GetMinimum();
   double histymax = hist->GetMaximum();

   // calculate the minimum and maximum of the function value based on
   // the minimum and maximum value in y.
   double ymin = TMath::Max(0., histymin - 5. * sqrt(histymin));
   double ymax = histymax + 5. * sqrt(histymax);

   // set the data boundaries for x and y values.
   SetDataBoundaries(0, xmin, xmax);
   SetDataBoundaries(1, ymin, ymax);

   // set the indeces for fitting.
   SetFitFunctionIndices(0, 1);

   // no error
   return 1;
}
| int BCHistogramFitter::SetHistogramExpected | ( | const std::vector< double > & | parameters | ) |
- Parameters:
-
hist The histogram with the expected counts (typically non-integer values!)
- Returns:
- An error code (1:pass, 0:fail).
Definition at line 150 of file BCHistogramFitter.cxx.
{
//clear up previous memory
if (fHistogramExpected) {
delete fHistogramExpected;
}
//copy all properties from the data histogram
fHistogramExpected = new TH1D(*fHistogram);
// get the number of bins
int nBins = fHistogramExpected->GetNbinsX();
// get bin width
double dx = fHistogramExpected->GetBinWidth(1);
//set the parameters of fit function
fFitFunction->SetParameters(¶meters[0]);
// get function value of lower bin edge
double fedgelow = fFitFunction->Eval(fHistogramExpected->GetBinLowEdge(1));
// loop over all bins, skip underflow
for (int ibin = 1; ibin <= nBins; ++ibin) {
// get upper bin edge
double xedgehi = fHistogramExpected->GetBinLowEdge(ibin) + dx;
//expected count
double yexp = 0.;
// use ROOT's TH1D::Integral method
if (fFlagIntegration)
yexp = fFitFunction->Integral(xedgehi - dx, xedgehi);
// use linear interpolation
else {
// get function value at upper bin edge
double fedgehi = fFitFunction->Eval(xedgehi);
yexp = fedgelow * dx + (fedgehi - fedgelow) * dx / 2.;
// make the upper edge the lower edge for the next iteration
fedgelow = fedgehi;
}
//write the expectation for the bin
fHistogramExpected->SetBinContent(ibin, yexp);
//avoid automatic error as sqrt(yexp), used e.g. in Kolmogorov correction factor
fHistogramExpected->SetBinError(ibin, 0.0);
// but the data under this model have that sqrt(yexp) uncertainty
fHistogram->SetBinError(ibin, sqrt(yexp));
}
return 1;
}
Member Data Documentation
TGraph* BCHistogramFitter::fErrorBand [private] |
Pointer to the error band (for legend)
Definition at line 252 of file BCHistogramFitter.h.
TF1* BCHistogramFitter::fFitFunction [private] |
The fit function
Definition at line 243 of file BCHistogramFitter.h.
bool BCHistogramFitter::fFlagIntegration [private] |
Flag for using the ROOT TH1D::Integral method (true), or linear interpolation (false)
Definition at line 248 of file BCHistogramFitter.h.
TGraph* BCHistogramFitter::fGraphFitFunction [private] |
Pointer to a graph for displaying the fit function
Definition at line 256 of file BCHistogramFitter.h.
TH1D* BCHistogramFitter::fHistogram [private] |
The histogram containing the data.
Definition at line 239 of file BCHistogramFitter.h.
TH1D* BCHistogramFitter::fHistogramExpected [private] |
The histogram containing the expected data.
Definition at line 261 of file BCHistogramFitter.h.
The documentation for this class was generated from the following files: